TikZ Code to Diagram Playgound
- Authors
- TikZ Code to Diagram Playgound
MassiveDiag Playground: The Ultimate TikZ Code to Diagram Converter
1. Introduction
Creating precise and visually appealing diagrams in LaTeX is now faster and easier than ever with MassiveDiag Playground. This intuitive web app converts TikZ code into SVG, PNG, Word documents, and PDFs—all in just a few clicks. Whether you're a student, researcher, engineer, or data scientist, MassiveDiag helps bring your technical illustrations to life effortlessly.
✨ Try it now: MassiveDiag Playground
2. What is a TikZ Diagram?
TikZ is a powerful LaTeX package used to create high-quality graphics programmatically. TikZ diagrams are widely used in academia for visualizing geometry, networks, graphs, flowcharts, and more—all directly from code. They're perfect for mathematical precision and seamless integration into LaTeX documents.
3. Supported TikZ Diagram Types
MassiveDiag Playground supports a wide range of TikZ-based diagrams, including:
- Geometric shapes
- Graphs and networks
- Flowcharts
- Mind maps
- Trees and hierarchical structures
- Coordinate plots
- Custom illustrations
Whether your diagram is simple or complex, MassiveDiag can render it with clarity and precision.
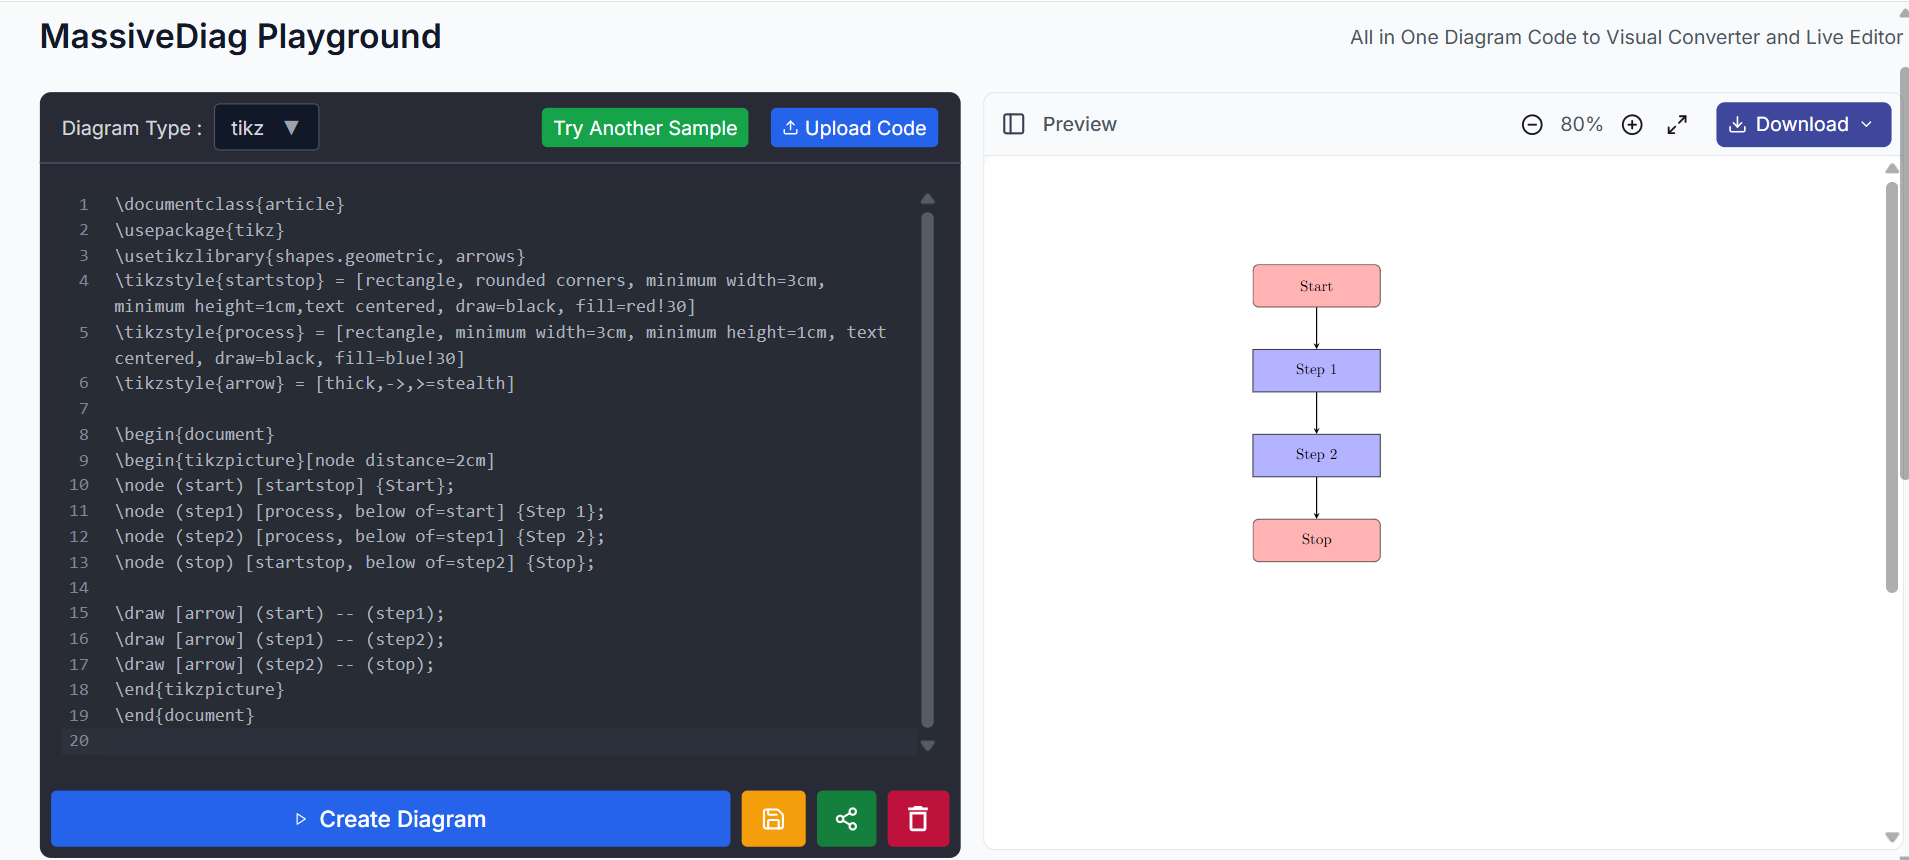
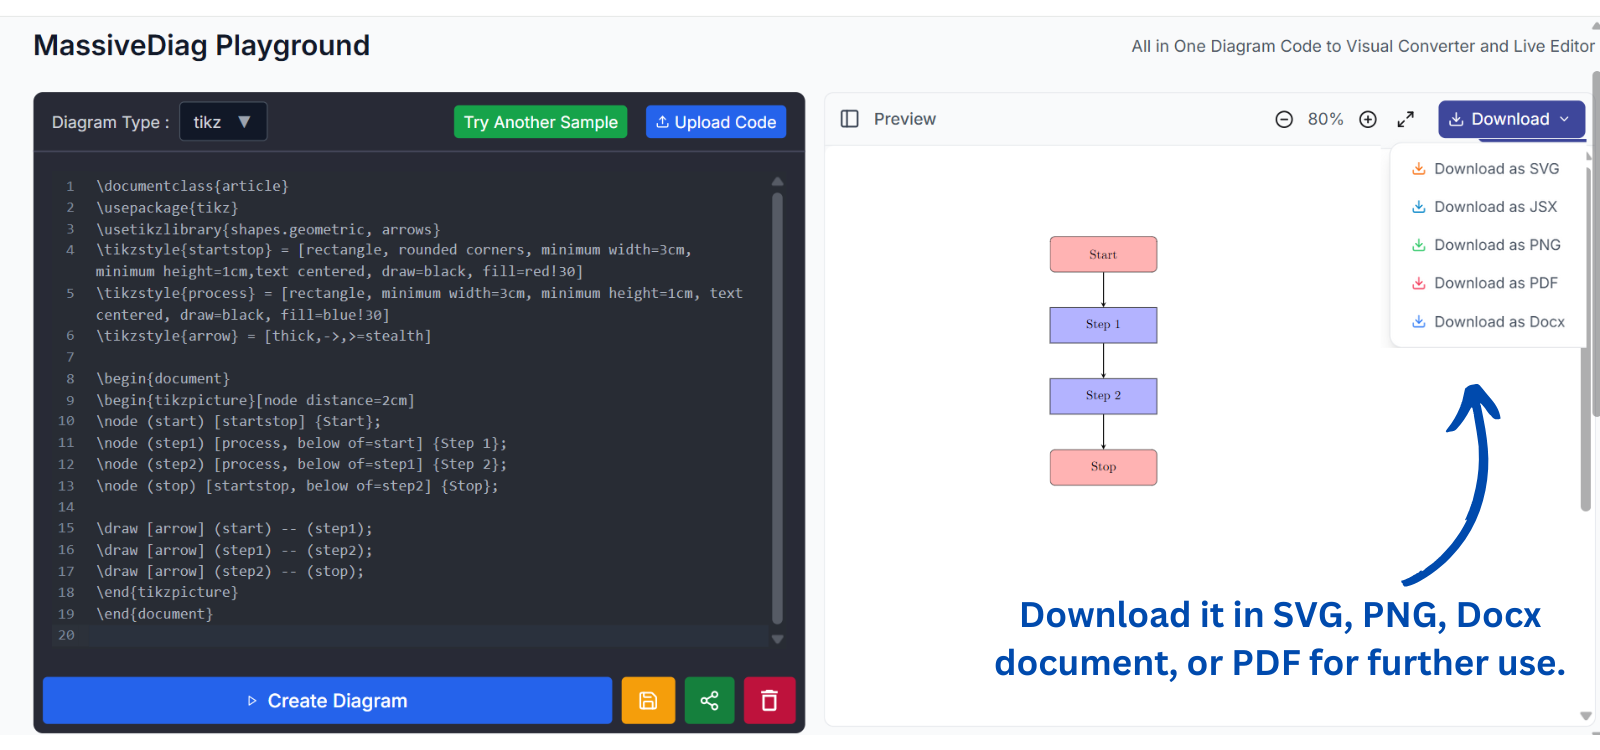
4. Example of a TikZ Diagram
Sample TikZ Code:
\documentclass{article}
\usepackage{tikz}
\usetikzlibrary{shapes.geometric, arrows}
\tikzstyle{startstop} = [rectangle, rounded corners, minimum width=3cm, minimum height=1cm,text centered, draw=black, fill=red!30]
\tikzstyle{process} = [rectangle, minimum width=3cm, minimum height=1cm, text centered, draw=black, fill=blue!30]
\tikzstyle{arrow} = [thick,->,>=stealth]

\begin{document}
\begin{tikzpicture}[node distance=2cm]
\node (start) [startstop] {Start};
\node (step1) [process, below of=start] {Step 1};
\node (step2) [process, below of=step1] {Step 2};
\node (stop) [startstop, below of=step2] {Stop};

\draw [arrow] (start) -- (step1);
\draw [arrow] (step1) -- (step2);
\draw [arrow] (step2) -- (stop);
\end{tikzpicture}
\end{document}
Generated Output:
5. Getting Started with TikZ Diagrams
To begin creating your TikZ diagrams:
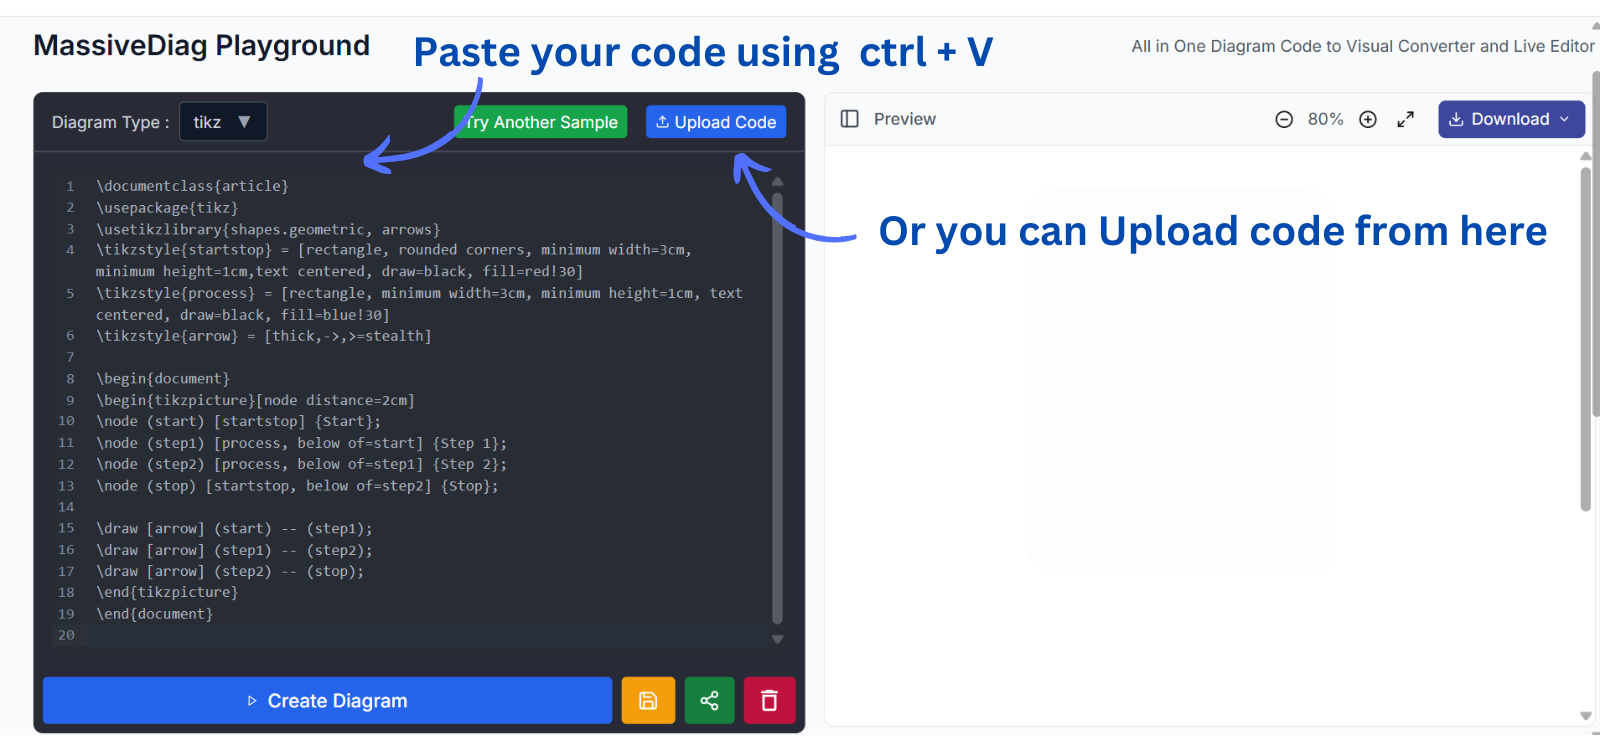
- Generate or write your TikZ code using LaTeX editors or AI tools.
- Copy and paste the code into the MassiveDiag Playground or upload a
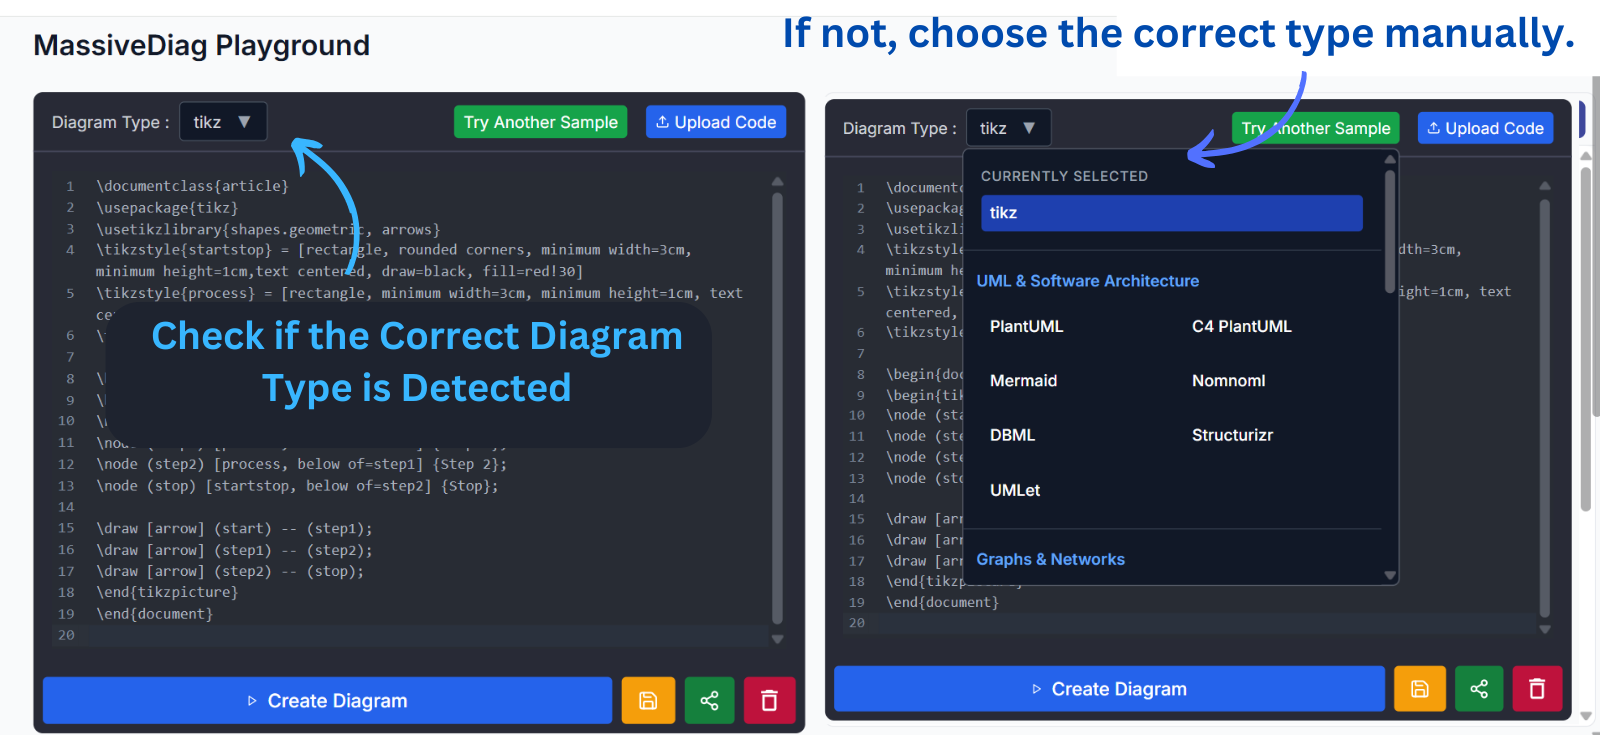
.texfile. - Let the system auto-detect the diagram type, or select it manually.
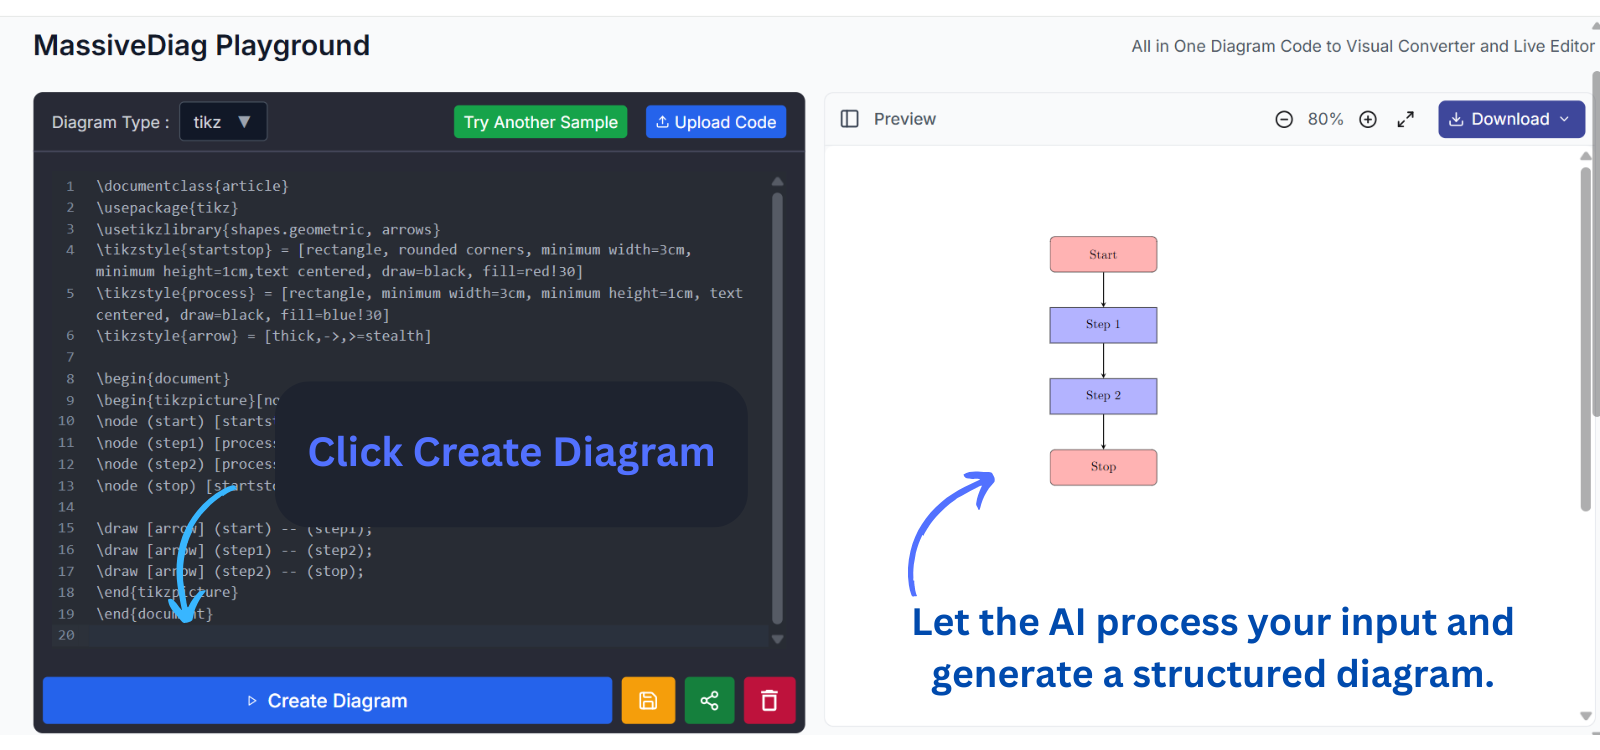
- Click "Create Diagram" and watch your code turn into a clean, exportable image.
6. How to Use TikZ in MassiveDiag
Here's the step-by-step process:
- 🧠 Create Code – Use any LaTeX editor or generate TikZ code using AI tools.
\documentclass{article}
\usepackage{tikz}
\usetikzlibrary{shapes.geometric, arrows}
\tikzstyle{startstop} = [rectangle, rounded corners, minimum width=3cm, minimum height=1cm,text centered, draw=black, fill=red!30]
\tikzstyle{process} = [rectangle, minimum width=3cm, minimum height=1cm, text centered, draw=black, fill=blue!30]
\tikzstyle{arrow} = [thick,->,>=stealth]

\begin{document}
\begin{tikzpicture}[node distance=2cm]
\node (start) [startstop] {Start};
\node (step1) [process, below of=start] {Step 1};
\node (step2) [process, below of=step1] {Step 2};
\node (stop) [startstop, below of=step2] {Stop};

\draw [arrow] (start) -- (step1);
\draw [arrow] (step1) -- (step2);
\draw [arrow] (step2) -- (stop);
\end{tikzpicture}
\end{document}
📋 Upload or Paste – Add your TikZ code into the MassiveDiag Playground.
🔍 Auto Detect – Let MassiveDiag detect the type or adjust it manually.
⚙️ Generate – Hit the "Create Diagram" button.
💾 Download – Export your diagram in SVG, PNG, Word, or PDF formats.
7. Practical Use Cases
TikZ diagrams are perfect for:
- Academic papers and thesis illustrations
- Engineering schematics
- Mathematical visualizations
- Scientific presentations
- Algorithm and data structure illustrations
- Teaching materials and textbooks
- Physics and geometry experiments
MassiveDiag makes these use cases more accessible and time-efficient.
8. Multilanguage Support
MassiveDiag Playground is available in:
- 🇪🇸 Spanish
- 🇫🇷 French
- 🇩🇪 German
- 🇮🇹 Italian
- 🇨🇳 Chinese
- 🇯🇵 Japanese
- 🇷🇺 Russian
- 🇸🇦 Arabic
- 🇵🇹 Portuguese
- 🇮🇳 Hindi
- 🇰🇷 Korean
...and many more!
Global users can interact with the platform in their native language for a more comfortable and productive experience.
9. Tips for Effective TikZ Diagrams
- Use relative coordinates to keep diagrams modular.
- Comment your code for easier editing and reuse.
- Test incrementally – build diagrams piece by piece.
- Label wisely – keep nodes and labels concise.
- Use layers for complex diagrams (e.g.,
background,foreground). - Preview often with MassiveDiag’s live rendering.
10. FAQ About TikZ Diagrams and MassiveDiag
Q: Can I edit diagrams after generating them?
Yes! Use the built-in editor to tweak your diagram in real time.
Q: Does it support Overleaf code?
Absolutely. You can paste Overleaf-style TikZ code directly.
Q: Is MassiveDiag free?
Yes, 100% free for all users.
Q: Can I collaborate on diagrams?
Yes, you can export and share files for collaborative editing.
Q: Does it work on mobile?
Yes, it's responsive and works across devices.
11. Conclusion
MassiveDiag Playground is the ideal tool for anyone using TikZ to create diagrams. With real-time preview, multi-format export, and AI-powered diagram detection, it's the fastest way to turn code into professional visuals. Say goodbye to manual compilation headaches—just paste, preview, and download!
✨ Get started now: MassiveDiag Playground