Vega Diagram Viewer
- Authors
- Vega Diagram Viewer
MassiveDiag Playground: The Ultimate Vega Diagram Viewer & Editor
1. Introduction
Looking for a powerful way to convert Vega code into sleek, professional diagrams? MassiveDiag Playground is your go-to tool! With an intuitive live editor, AI-powered code detection, and multiple export options (SVG, PNG, Word, PDF), you can instantly transform your Vega syntax into shareable visuals. Ideal for developers, analysts, technical writers, and data visualization experts.
✨ Try it now: MassiveDiag Playground
2. What is a Vega Diagram?
Vega diagrams are data-driven, interactive visualizations created using the Vega specification— a declarative JSON format for building charts, graphs, and infographics. Vega enables customization, scalability, and reusability, making it perfect for presenting complex data in a meaningful way.
3. Supported Vega Diagrams
MassiveDiag Playground supports a wide range of Vega-based visualizations, including:
- Bar Charts
- Line Graphs
- Scatter Plots
- Pie Charts
- Heatmaps
- Histograms
- Area Charts
- Tree Maps
- Network Graphs
- and more!
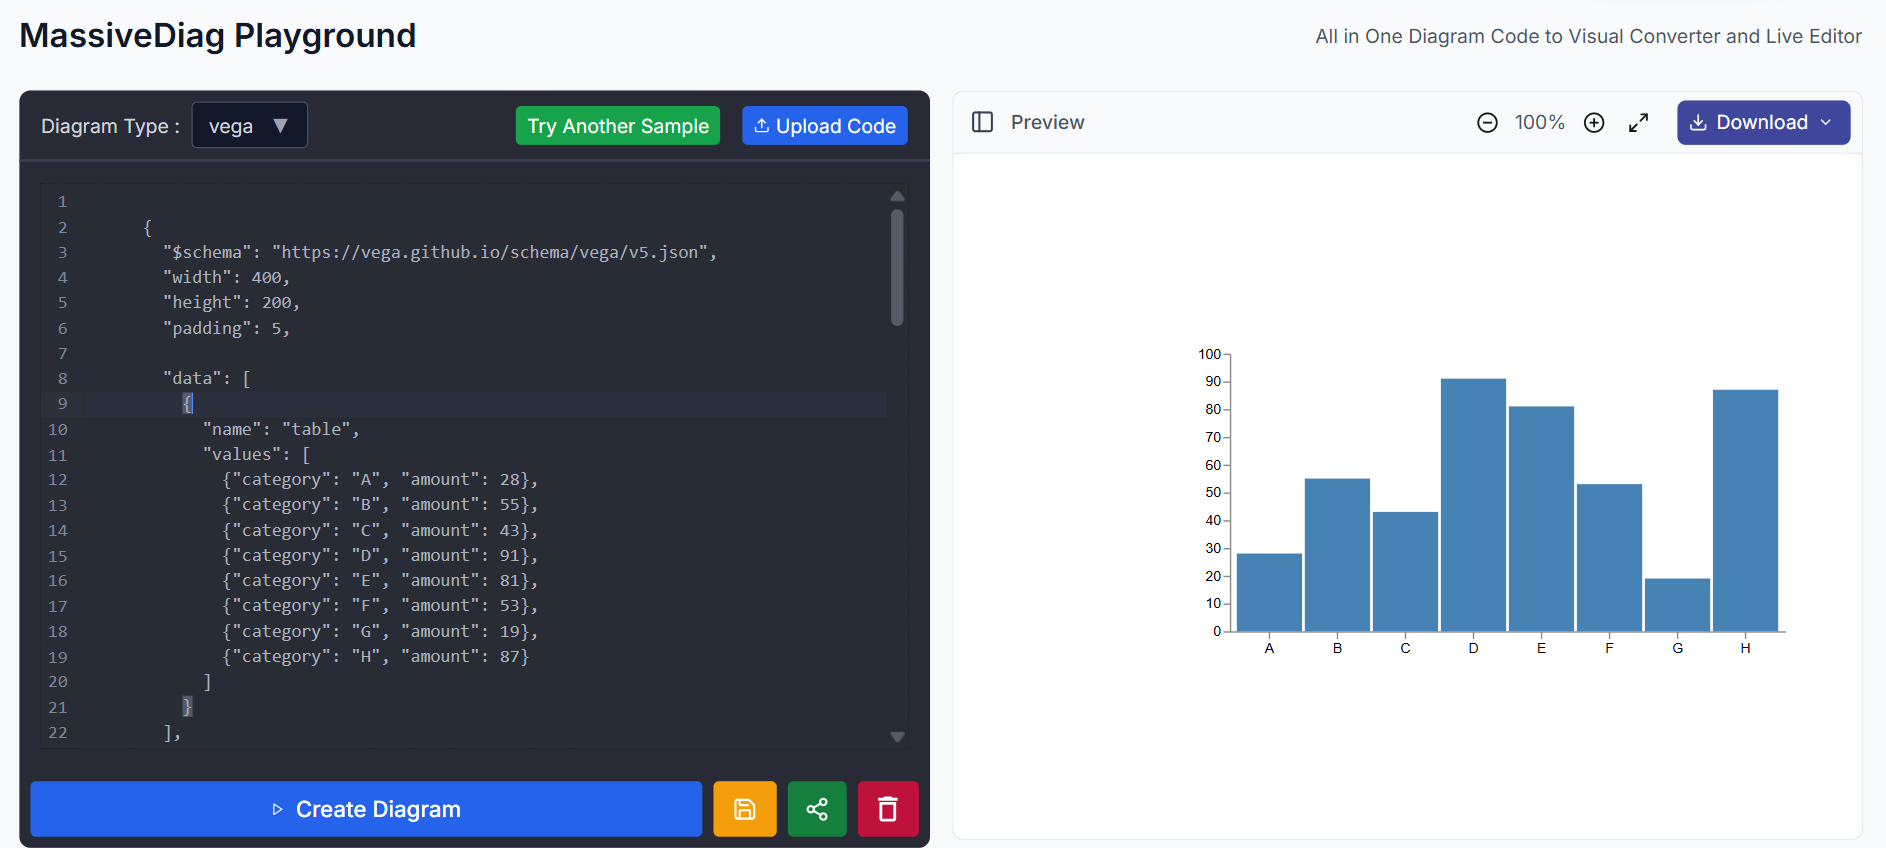
4. Example of a Vega Diagram
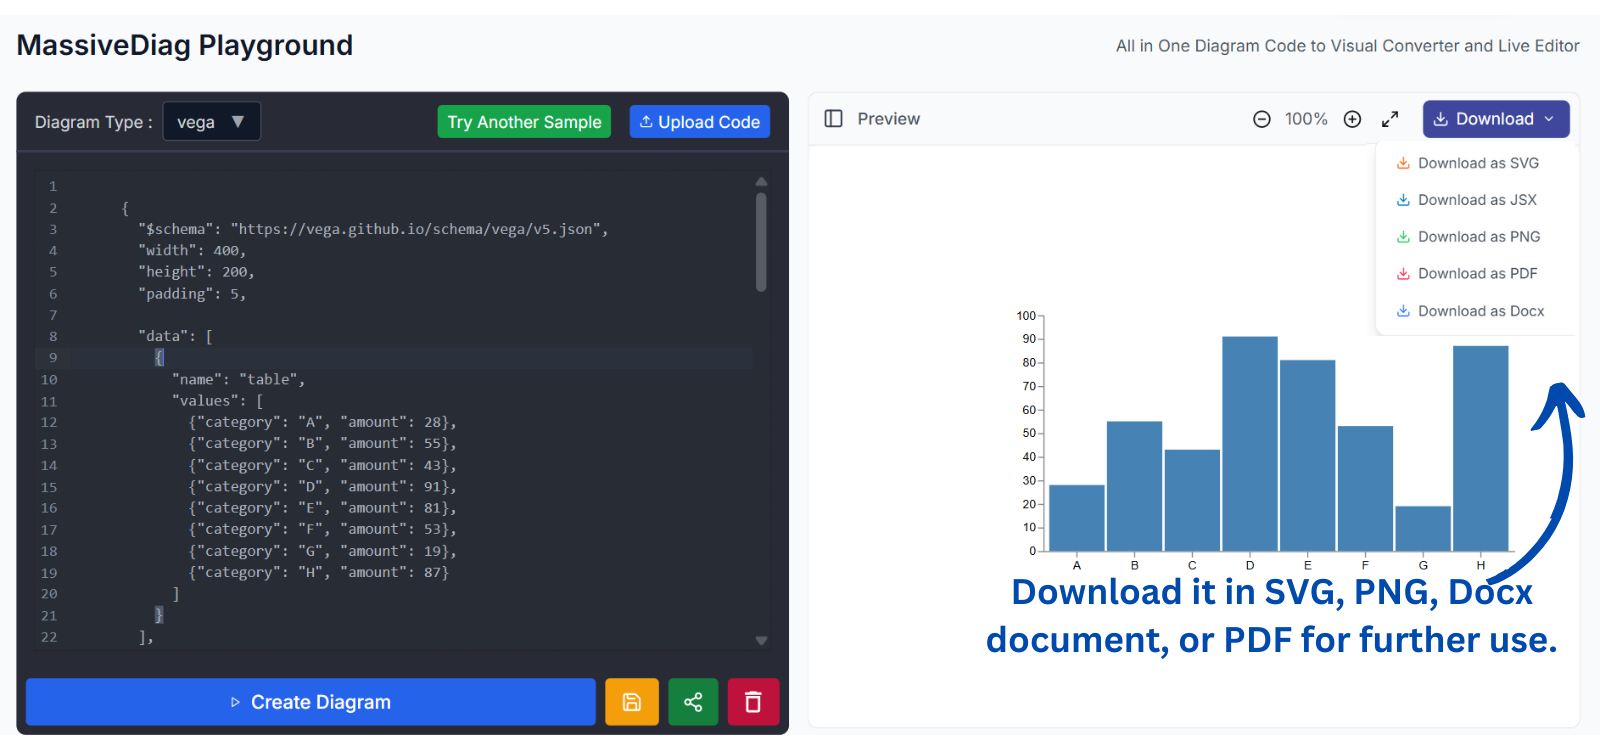
Here's an example of Vega code that creates a simple bar chart:
  {
    "$schema": "https://vega.github.io/schema/vega/v5.json",
    "width": 400,
    "height": 200,
    "padding": 5,

    "data": [
      {
        "name": "table",
        "values": [
          {"category": "A", "amount": 28},
          {"category": "B", "amount": 55},
          {"category": "C", "amount": 43},
          {"category": "D", "amount": 91},
          {"category": "E", "amount": 81},
          {"category": "F", "amount": 53},
          {"category": "G", "amount": 19},
          {"category": "H", "amount": 87}
        ]
      }
    ],

    "signals": [
      {
        "name": "tooltip",
        "value": {},
        "on": [
          {"events": "rect:mouseover", "update": "datum"},
          {"events": "rect:mouseout",  "update": "{}"}
        ]
      }
    ],

    "scales": [
      {
        "name": "xscale",
        "type": "band",
        "domain": {"data": "table", "field": "category"},
        "range": "width",
        "padding": 0.05,
        "round": true
      },
      {
        "name": "yscale",
        "domain": {"data": "table", "field": "amount"},
        "nice": true,
        "range": "height"
      }
    ],

    "axes": [
      { "orient": "bottom", "scale": "xscale" },
      { "orient": "left", "scale": "yscale" }
    ],

    "marks": [
      {
        "type": "rect",
        "from": {"data":"table"},
        "encode": {
          "enter": {
            "x": {"scale": "xscale", "field": "category"},
            "width": {"scale": "xscale", "band": 1},
            "y": {"scale": "yscale", "field": "amount"},
            "y2": {"scale": "yscale", "value": 0}
          },
          "update": {
            "fill": {"value": "steelblue"}
          },
          "hover": {
            "fill": {"value": "red"}
          }
        }
      },
      {
        "type": "text",
        "encode": {
          "enter": {
            "align": {"value": "center"},
            "baseline": {"value": "bottom"},
            "fill": {"value": "#333"}
          },
          "update": {
            "x": {"scale": "xscale", "signal": "tooltip.category", "band": 0.5},
            "y": {"scale": "yscale", "signal": "tooltip.amount", "offset": -2},
            "text": {"signal": "tooltip.amount"},
            "fillOpacity": [
              {"test": "datum === tooltip", "value": 0},
              {"value": 1}
            ]
          }
        }
      }
    ]
  }
🖼️ Output: A clean, structured bar chart—rendered instantly inside MassiveDiag Playground.
5. Getting Started with Vega Diagrams
- Write or generate your Vega code.
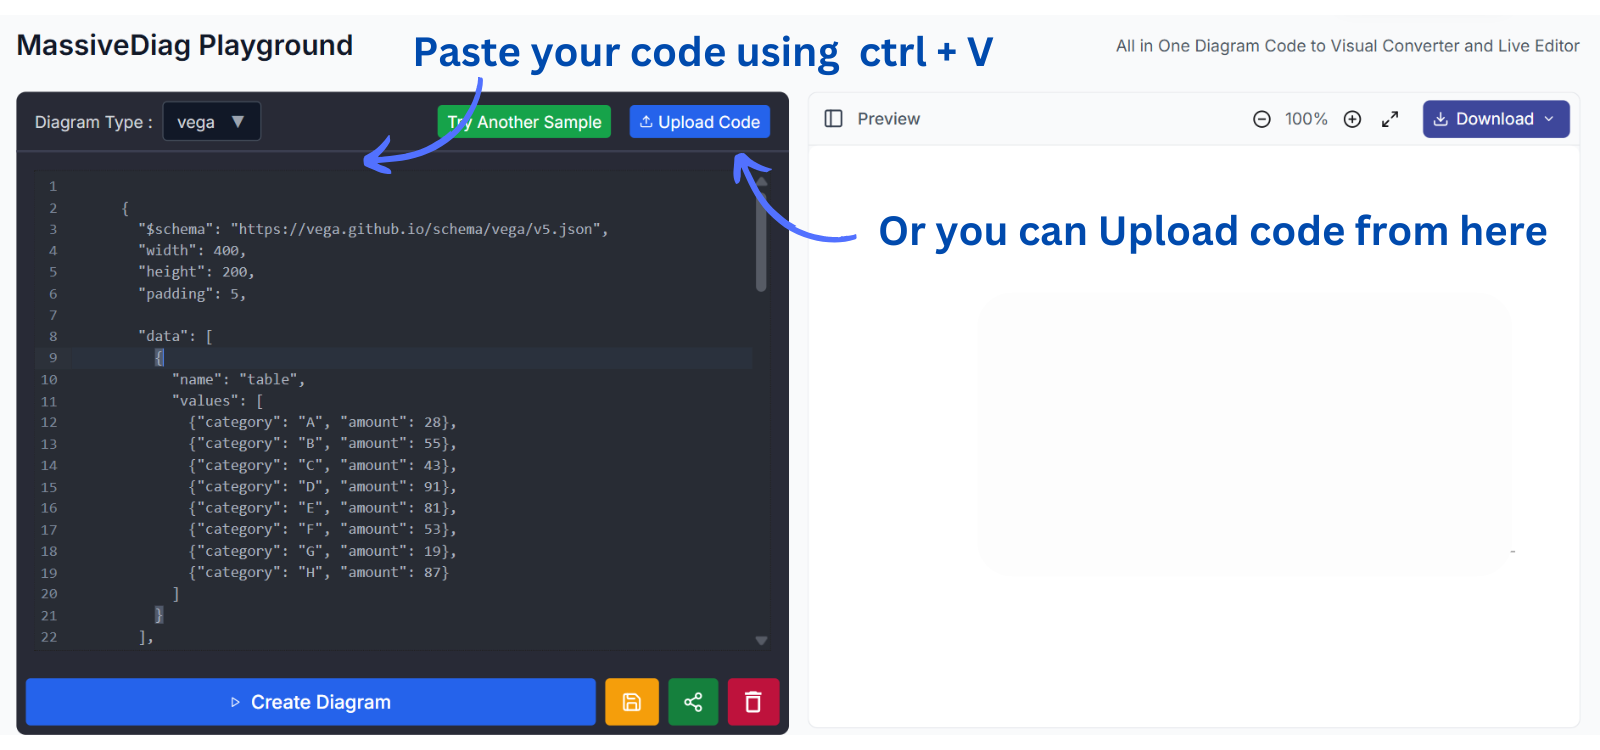
- Paste it into MassiveDiag Playground.
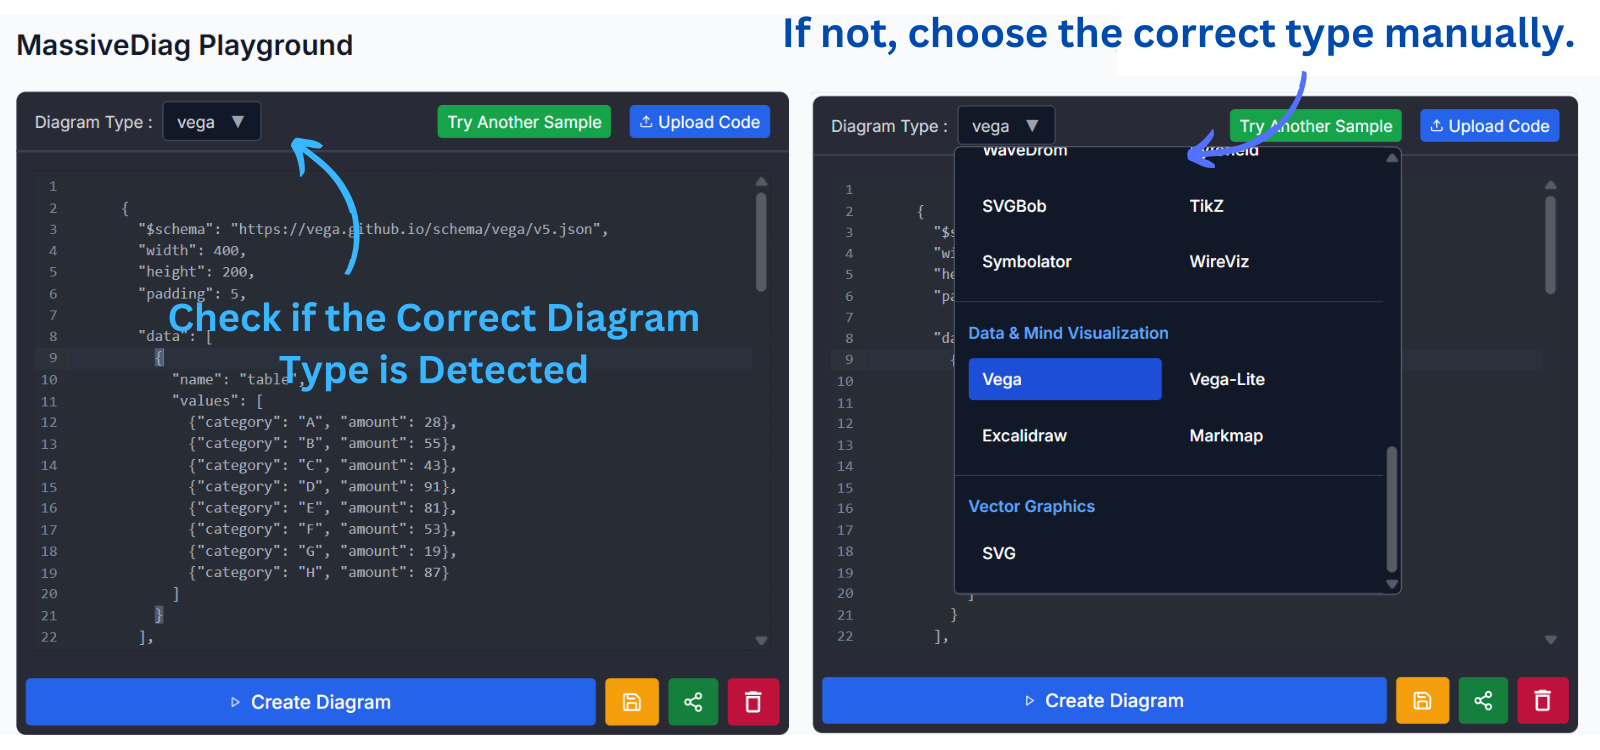
- Select Vega as the diagram type if it isn't auto-detected.
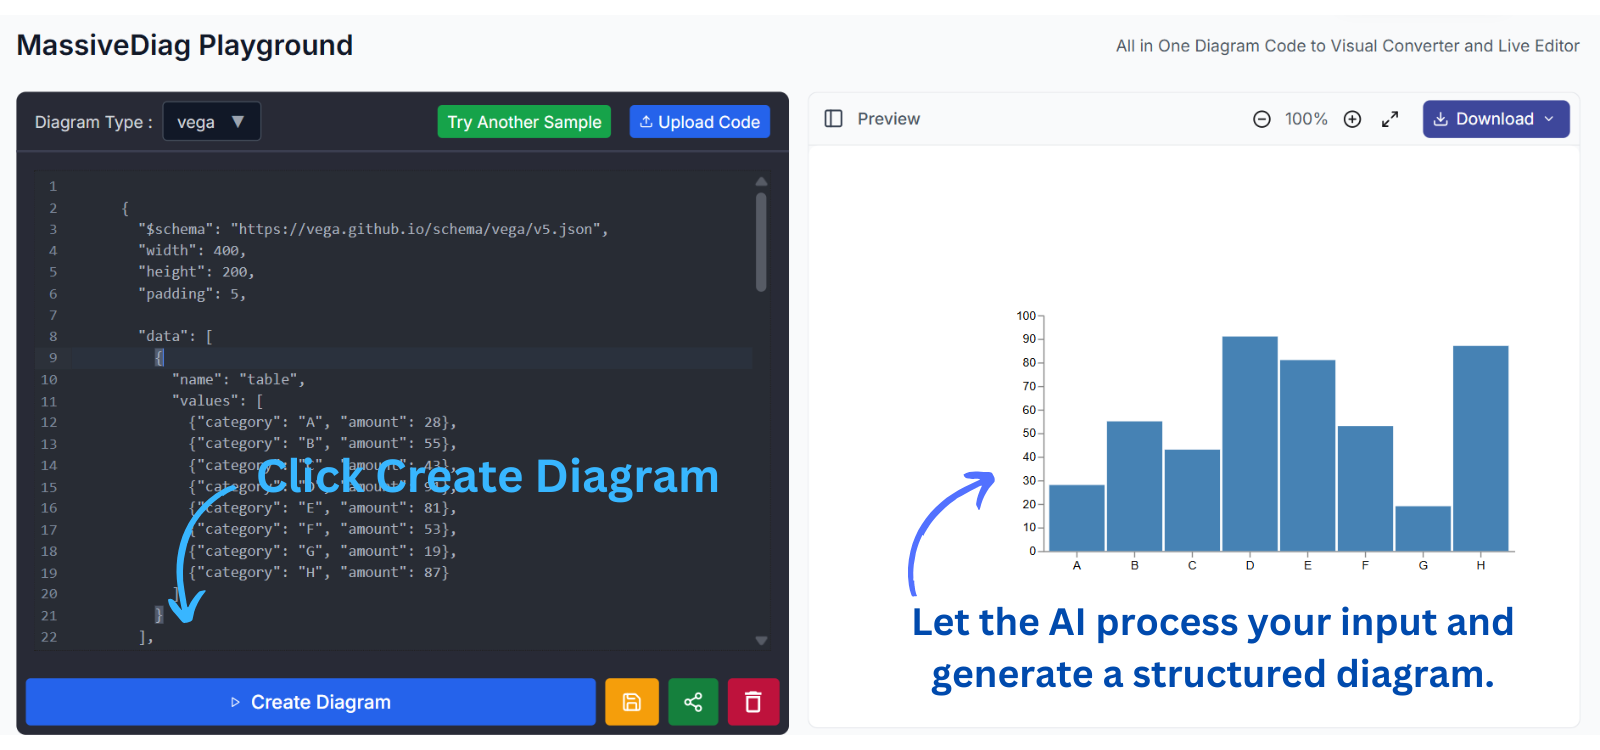
- Click "Create Diagram" to visualize.
- Preview and export in your desired format: SVG, PNG, Word, or PDF.
6. How to Use Vega Diagrams with MassiveDiag
Generate or Write Code – Create BlockDiag code manually or use AI tools.
Paste Code into MassiveDiag Playground or upload Vega code.
- Verify Diagram Type – Ensure the correct diagram type is detected or select manually.
- Generate Diagram – Click the create button to convert the code into a structured diagram.
- Preview & Export – Download the diagram in SVG, PNG, PDF, or Word formats.
7. Practical Use Cases
- 📊 Data Analysis – Visualize datasets dynamically.
- 📚 Education – Explain complex data structures.
- 🧑💻 Software Documentation – Showcase data flow or process logic.
- 📈 Dashboards – Integrate into real-time analytics platforms.
- 📖 Reports & Publications – Export visuals for academic or business use.
8. Multilanguage Support
MassiveDiag Playground offers interface and usage guidance in:
- Spanish
- French
- German
- Italian
- Chinese
- Japanese
- Russian
- Arabic
- Portuguese
- Hindi
- Korean
- ...and more!
9. Tips for Effective Vega Diagrams
- ✅ Keep your data structured and minimal.
- ✅ Use appropriate scales and axis definitions.
- ✅ Test responsiveness with different widths/heights.
- ✅ Leverage interactivity to make your visualizations engaging.
- ✅ Use tooltips and legends for better data clarity.
10. FAQ About Vega Diagrams and MassiveDiag
Q: Do I need to install anything to use MassiveDiag Playground?
A: Nope! It's entirely web-based—no setup required.
Q: Can I edit my Vega code directly?
A: Yes, the live editor lets you tweak and preview your changes instantly.
Q: Are there templates I can start with?
A: Absolutely! Use starter examples or generate code using AI.
Q: Can I export high-resolution diagrams?
A: Yes. Export your diagrams as SVG, PNG, PDF, or Word for maximum flexibility.
11. Conclusion
Whether you're a data analyst visualizing trends or a technical writer preparing documentation, MassiveDiag Playground empowers you to turn Vega code into polished, export-ready diagrams—all in seconds. No software downloads. No learning curve. Just fast, beautiful visuals.
✨ Start diagramming today: Try MassiveDiag Playground